Introduction
Complex functions are crucial in mathematical analysis, with applications in engineering and physics. Visualizing these functions helps to understand their behavior in the complex plane, revealing patterns and symmetries. This aids in both grasping theoretical concepts and exploring new properties.
Domain Colring
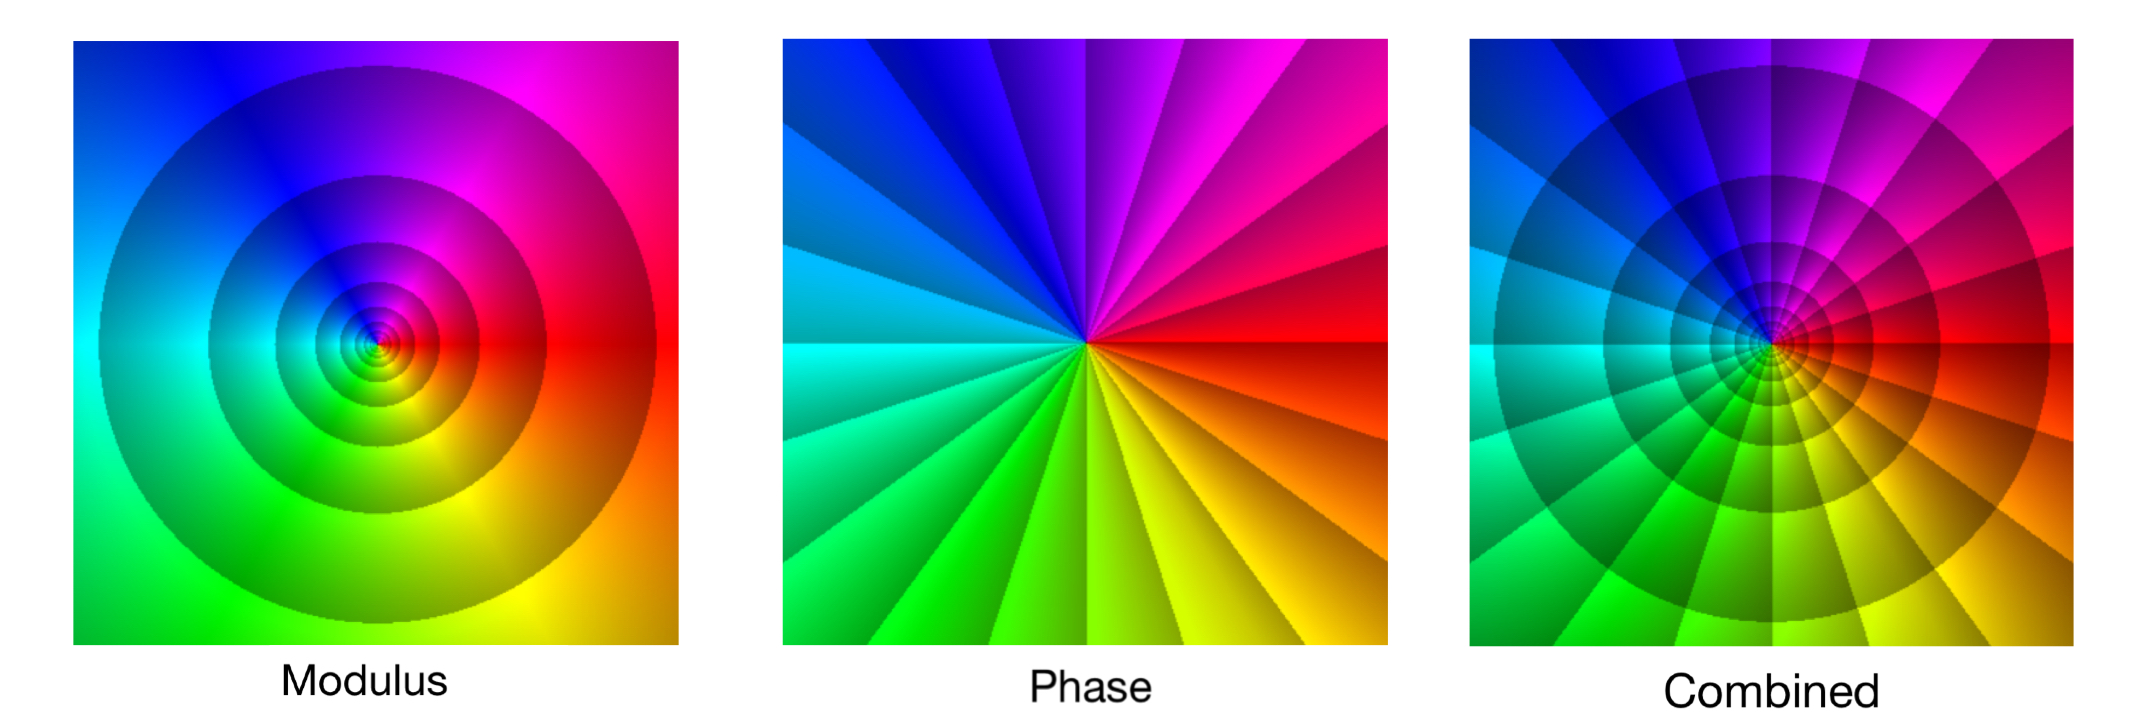
Domain coloring is a technique for visualizing complex functions by mapping the phase of complex numbers to colors. This creates a colorful representation of the complex plane, making it easier to observe function behaviors like zeros, poles, and overall structure. It’s a valuable tool in mathematics for enhancing understanding and analysis of complex functions.

This is the color wheel and plane phase portrait of $f(z)=z$
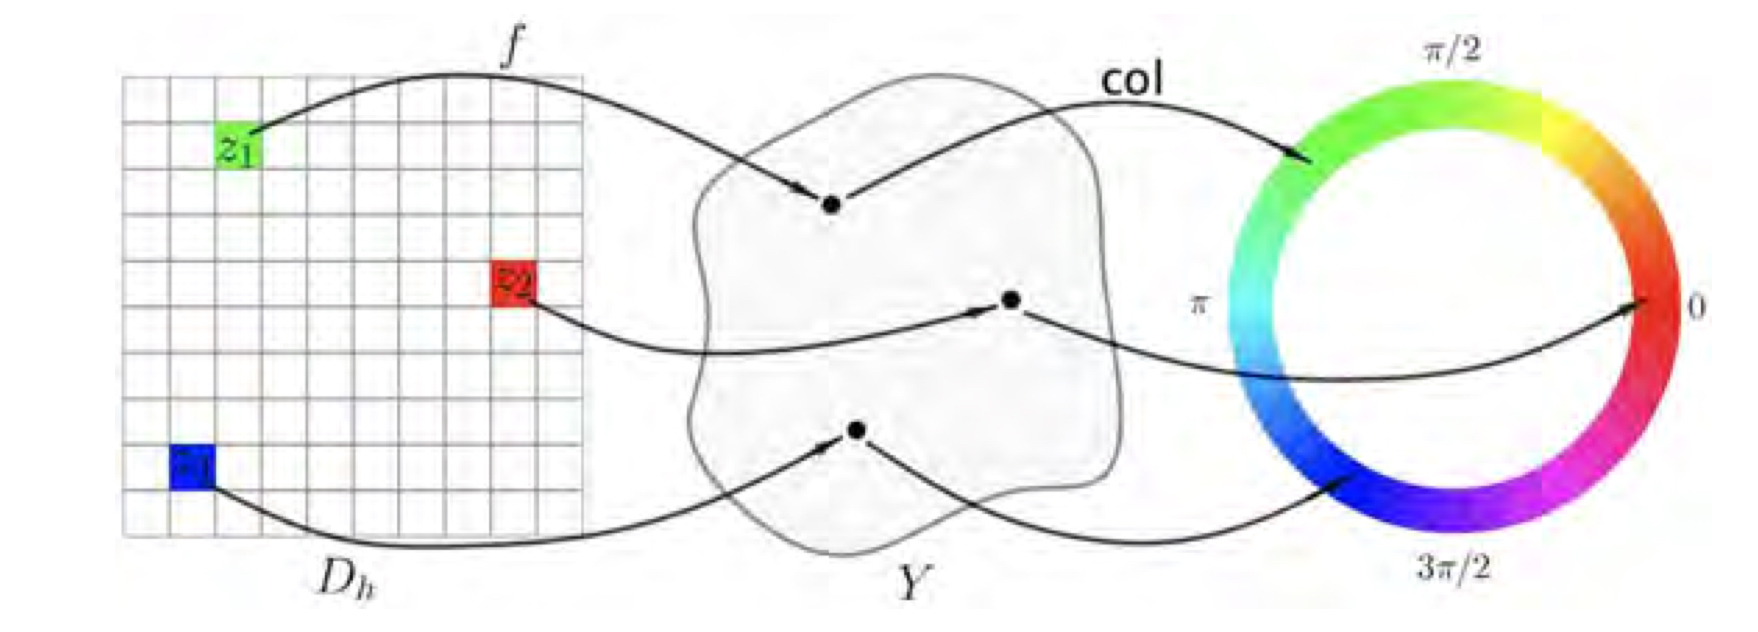
To implement this method, Suppose $D_h$ as the domain of a complex function $f(z)$, and every pixel $i$ is identified with a complex number $z_i$, then calculate the phase of the value $f(z)$ and corresponding color. Finally assign the resulting color to the pixel. The figure below shows the procedure.
The enhanced phase portrait is the use of phase portraits with contour lines of phase and modulus. This figure shows that the enhanced portrait of $f(z)=\frac{1}{z}$
Isolated Singular Points
$z_0$ is called a singular point of a function $f$ if $f$ fails to be analytic at $z_0$ but is analytic at some point in every neighborhood of $z_0$, and $z_0$ is said to be isolated if there is a deleted neighborhood $0 < |z-z_0| <\epsilon$ of $z_0$ throughout which $f$ is analytic. If $f$ has an isolated singular point at $z_0$, then $f(z)$ has a Laurent series representation $$f(z) = \sum_{n=0}^{\infty}a_n(z-z_0)^n + \sum_{n=1}^{\infty}\frac{b_n}{(z-z_0)^n}$$
There are three types of isolated singular points, if a finite number of the coefficients $b_n$ are nonzero, then $z_0$ is called a pole of order $m$; when every $b_n = 0$, then $z_0$ is known as a removable singular point; if an infinite number of the coefficients $b_n$ are nonzero, $z_0$ is said to be an essential singular point of $f$.
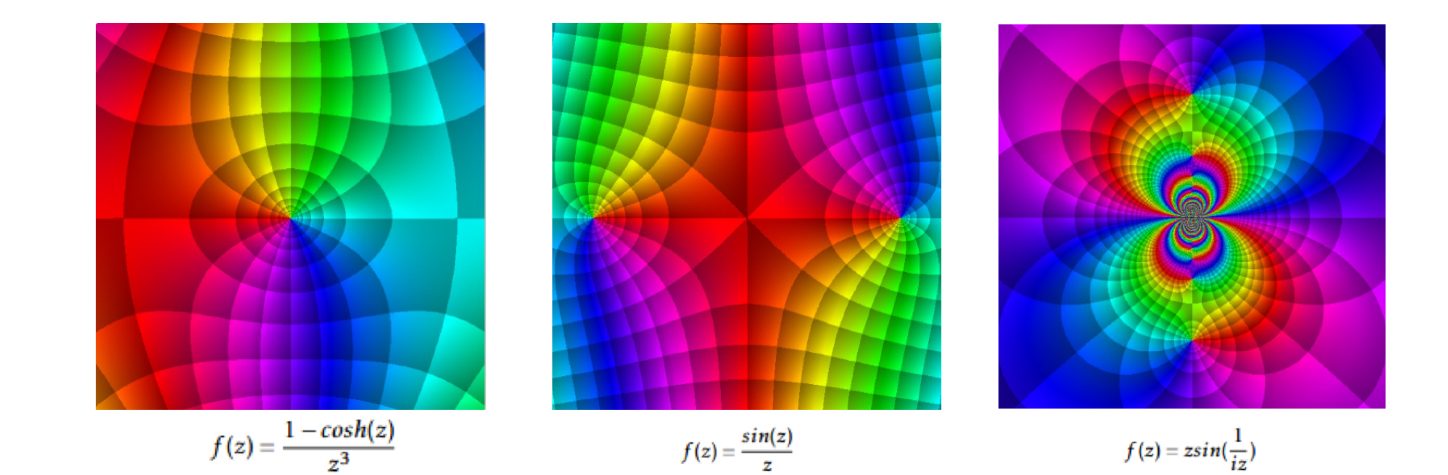
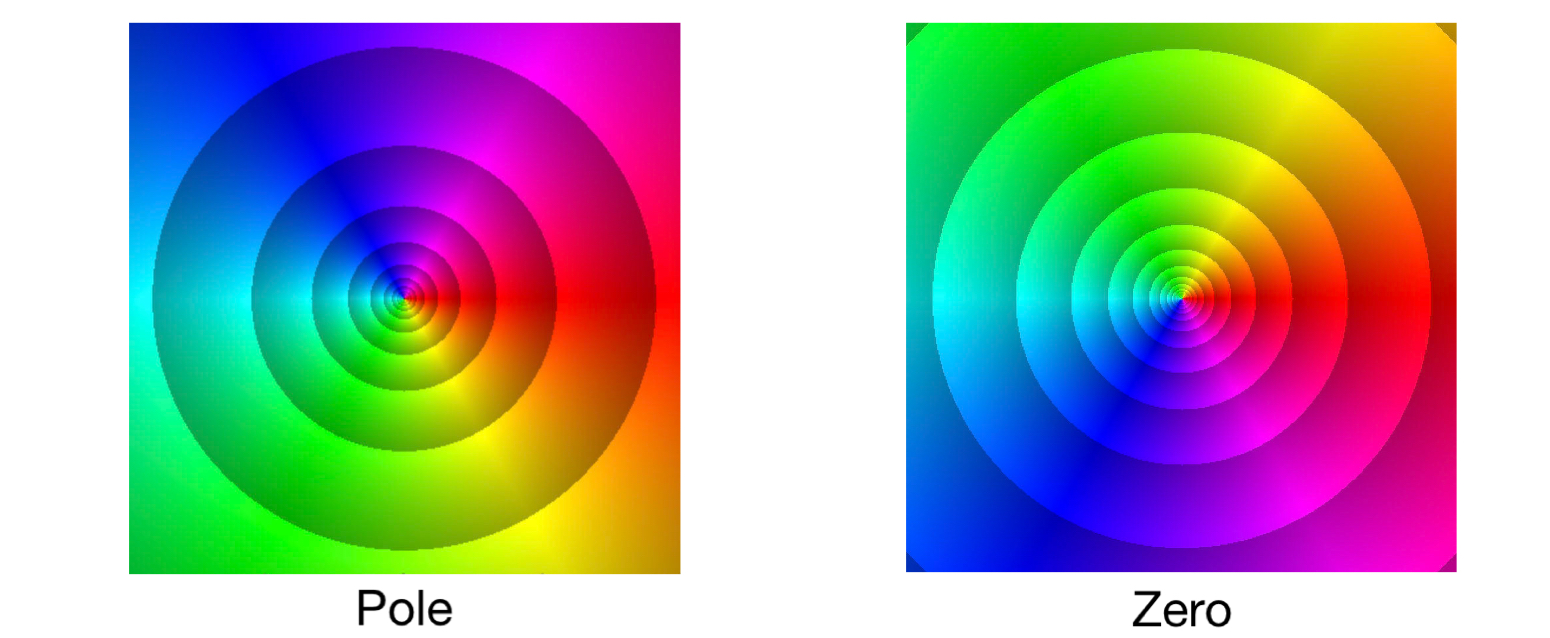
This figure shows an example of the visualization of pole, removable singular point, essential singular point respectively. In addition, poles and zeros can be quickly distinguished from each other by visualizing. Take $f(z)=1/z$ and $f(z)=z$ for example, it is easy to observe that the domain coloring of the zeros is counterclockwise, while the domain coloring of the poles is clockwise. The following images show the visualization of the zero point and the poles
Conformal Mapping
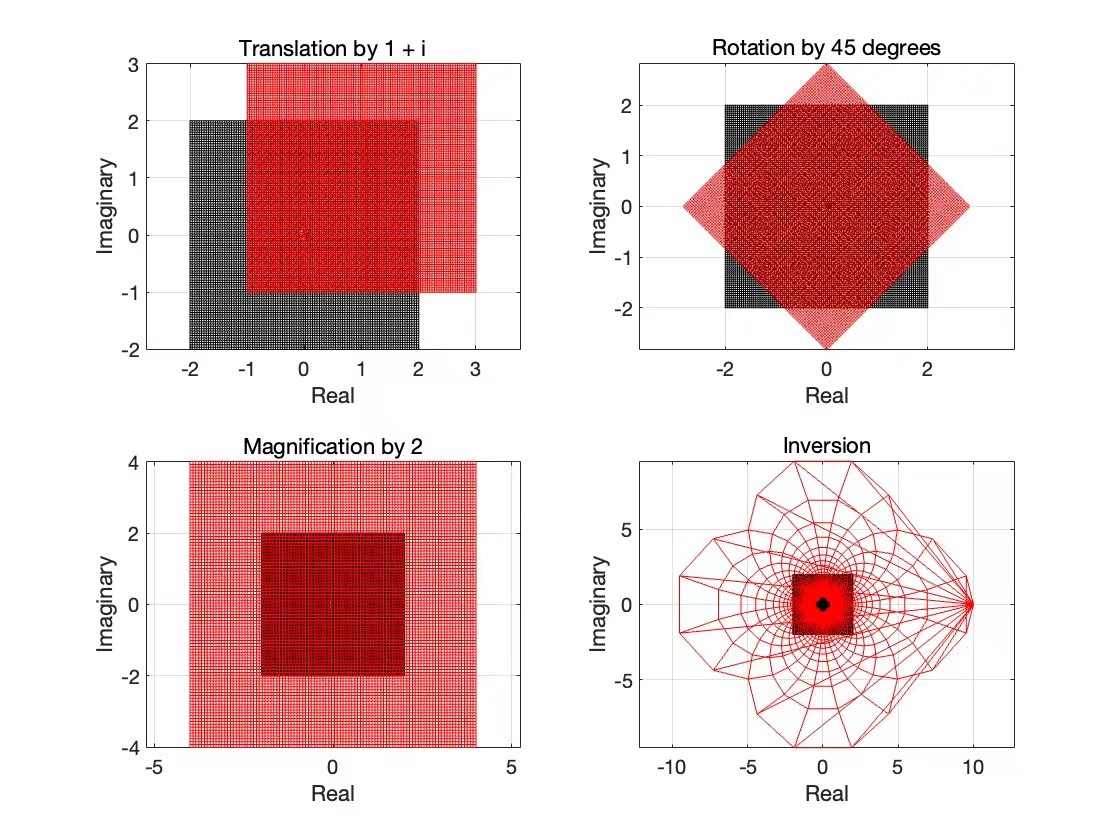
A conformal mapping, also called a conformal map, conformal transformation, angle-preserving transformation, or biholomorphic map, is a transformation $w=f(z)$ that preserves local angles. An analytic function is conformal at any point where it has a nonzero derivative. For example, the mapping $w=\frac{1}{z}$ transforms circles and lines into circles and lines; $f(z)=z + b$, translates a point $z$ in the complex plane by $b$; $f(z) = e^{i\alpha}z$ rotates a point $z$ in the complex plane by an angle $\alpha$. Here are some examples of conformal mapping.
In order to find some interesting conformal mappings involving trigonometric functions, we look at the phase portrait of the sine function.
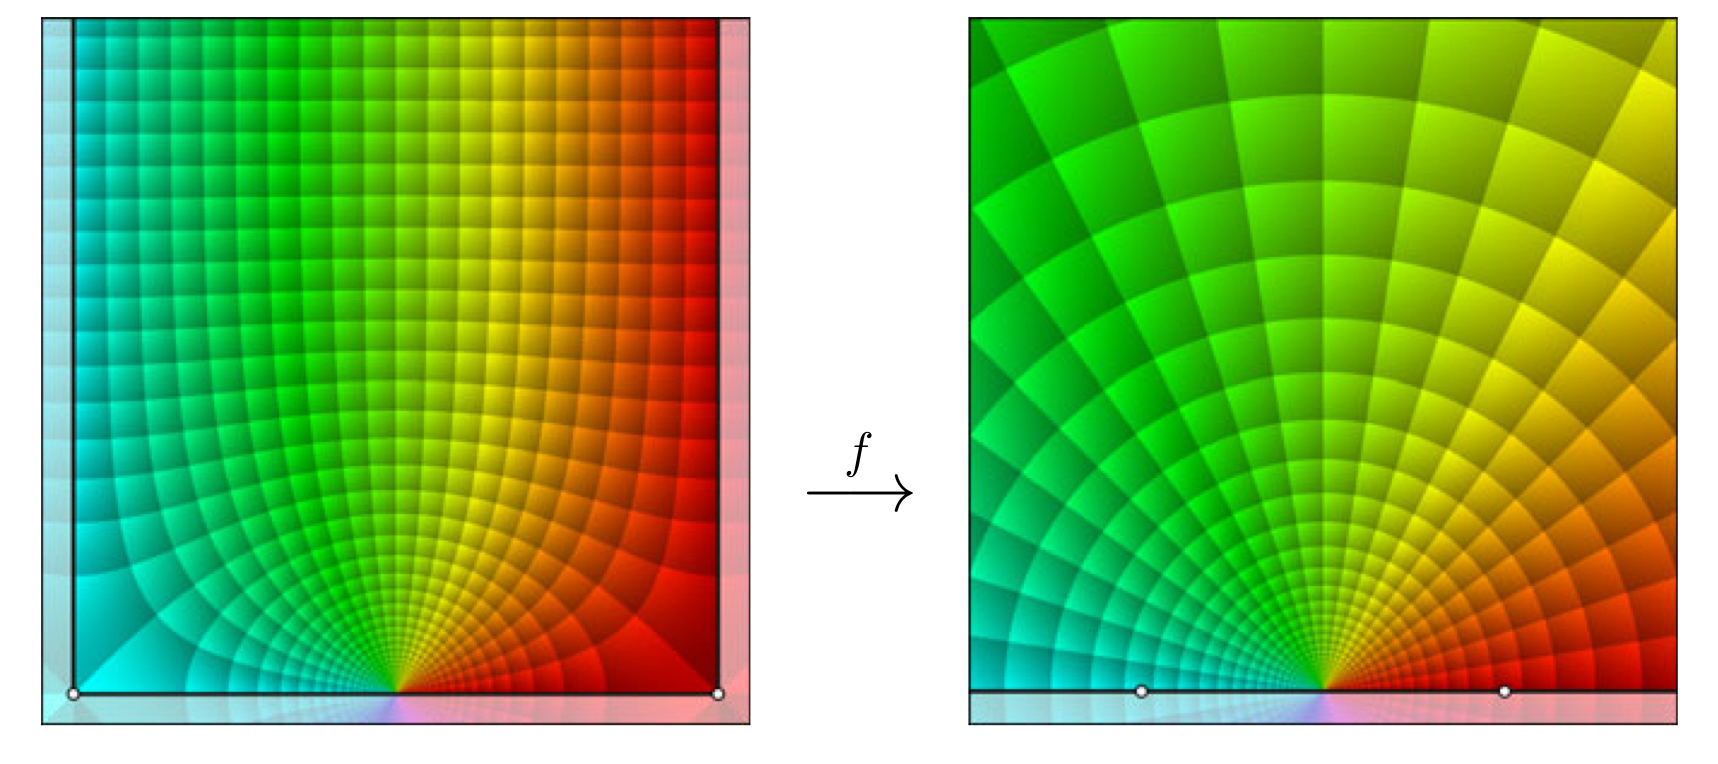
This figure suggests that the half-strip is mapped onto the upper half-plane.
Argument Principle
If $f(z)$ is meromorphic in a region $R$ enclosed by a contour $\gamma$, let $Z$ be the number of complex roots of $f(z)$ in $\gamma$, and $P$ be the number of poles in $\gamma$, with each zero and pole counted as many times as its multiplicity and order, respectively. Then $$Z-P = \frac{1}{2\pi i}\int_{\gamma}\frac{f’(z)}{f(z)}dz$$
$N-P$ is also defined as the \textbf{winding number} of $\gamma$ around $0$, which is denoted as $w(\gamma , 0)$. For a better understanding of argument principle, we choose $f(z) = z^5 - 2z +2$ and a circle with radius $1$ around $z = 0$
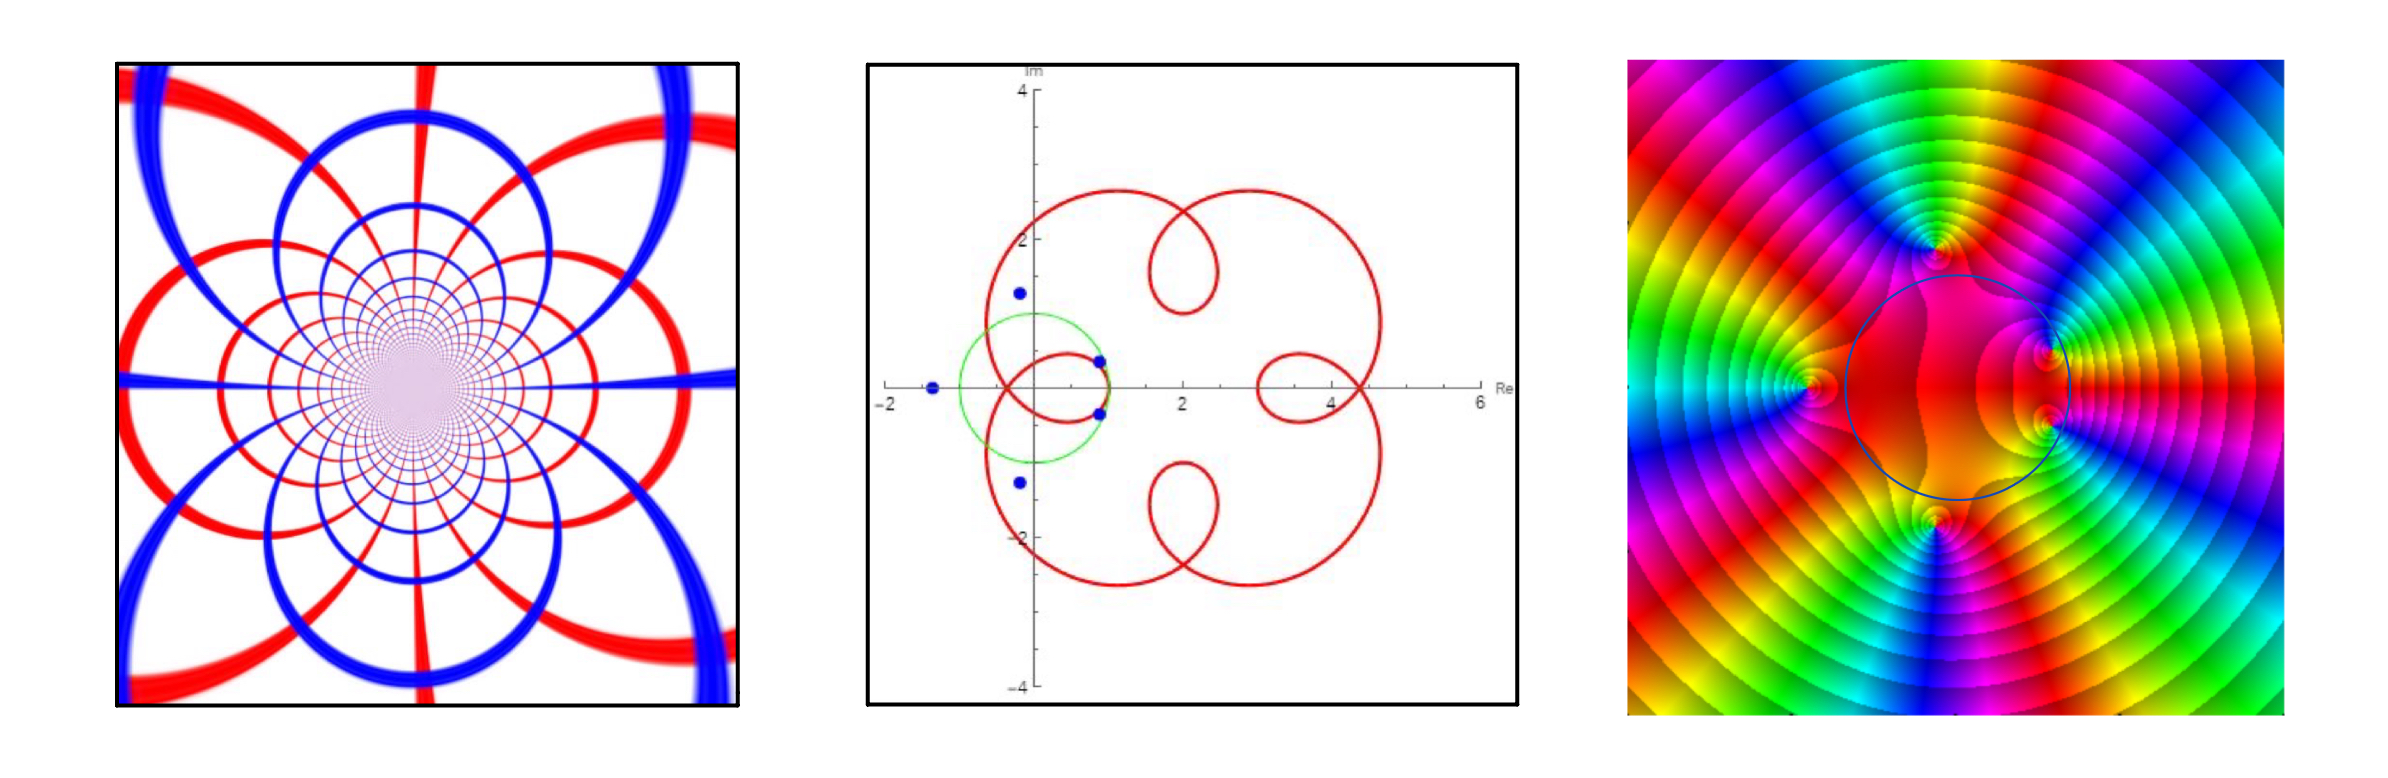
This figure shows that the visualization of $f(z)$, and it can be clearly seen that only two zeros are within this path. As a result of this observation, we can understand the distribution of zeros of a complex function as well as explain the relationship between phase changes and zeros.
Reference
[1] Ponce Campuzano J C. Domain colouring for visualising and exploring the beauty of complex functions[J]. Australian Mathematical Society. Gazette, 2021, 48(4): 162-170.
[2]Brown J W, Churchill R V. Complex variables and applications[M]. McGraw-Hill,, 2009.
[3]Ponce Campuzano J C. The use of phase portraits to visualize and investigate isolated singular points of complex functions[J]. International journal of mathematical education in science and technology, 2019, 50(7): 999-1010.